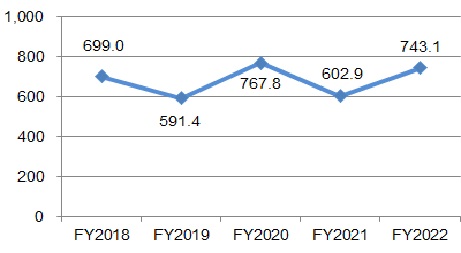
Financial Indictors
JPX has adopted the International Financial Reporting Standards (IFRS).
Please click here to download financial highlights data.
Please click here for details of financial results.
- The amounts shown reflect the stock split ( 2 for 1) that became effective on October 1, 2024.
The dividend per share figure for FY 2020 includes a special dividend of JPY 5 per share.
The dividend per share figure for FY 2021 includes a special dividend of JPY 7.5 per share.
The dividend per share figure for FY 2022 includes a commemorative dividend of JPY 5 per share.
The dividend per share figure for FY 2023 includes a special dividend of JPY 10 per share.
The dividend per share figure for FY 2024 includes a special dividend of JPY 10 per share.
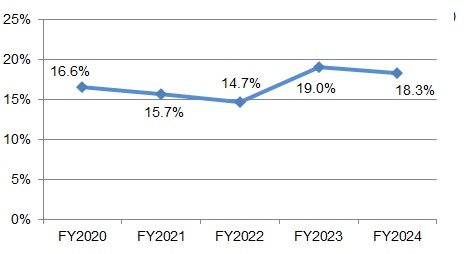
- <Return on equity attributable to owners of the parent company>
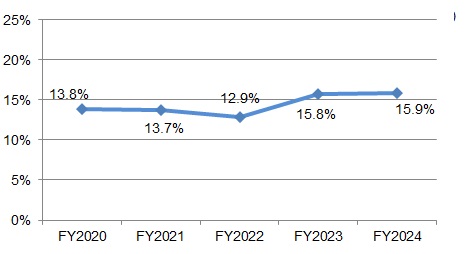
- <Return on invested capital>
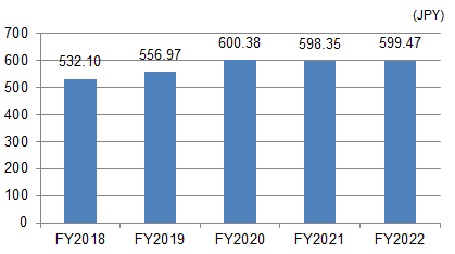
- <Total equity attributable to owners of the parent company per share>
- <Basic earnings per share>
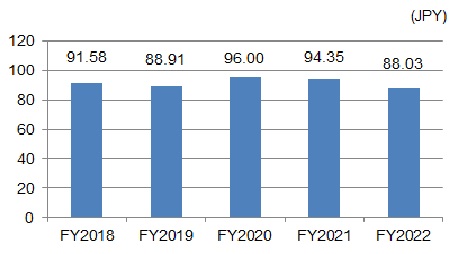
- <Dividends per share>
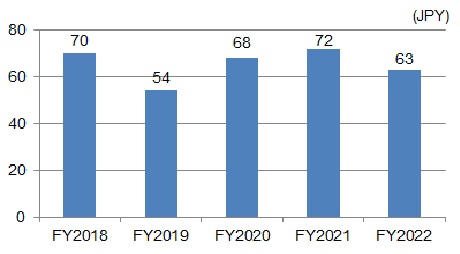
- <Ratio of interest-bearing debt to cash flow>
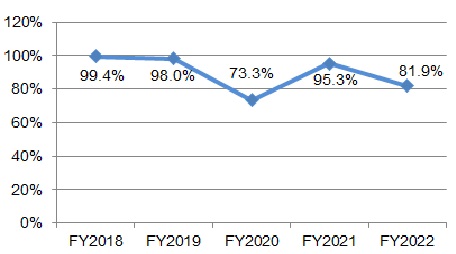
- <Interest coverage ratio>
