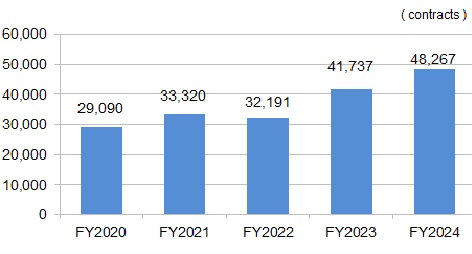
Market Data - Daily Average Trading Volume/Value
Please click here to download financial highlights data.
Please click here for details of financial results.
- Average daily trading value of auction and off-auction trades of common stock on the Prime, Standard, and Growth Markets (1st/2nd Sections, Mothers, and JASDAQ up to FY2021) and TOKYO PRO Market, as well as ETFs/ETNs/REITs, etc.
- Contracts of Nikkei 225 mini are calculated using a factor of 1/10.
- Excluding Weekly Options.
- <Cash Equities>
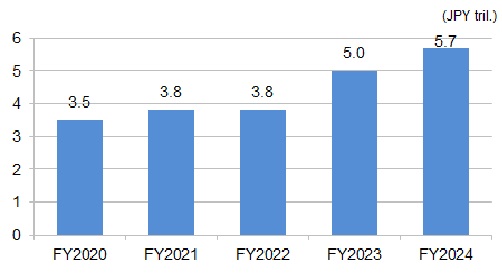
- <TOPIX Futures>
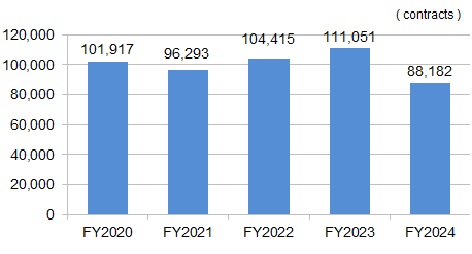
- <Nikkei 225 Futures>
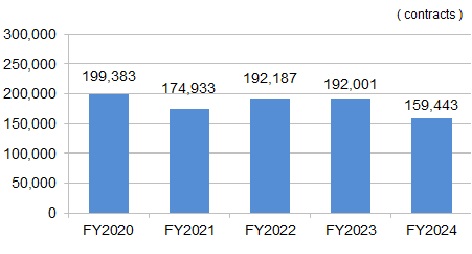
- <Nikkei 225 Options>
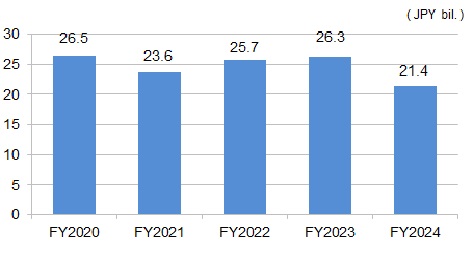
- <10-year JGB Futures>
