


Search results 4591-4600 / 10638
- sort:
- relevance
- latest
JPX-Nikkei 400 Leveraged and Inverse Index Guidebook May 22, 2015 Japan Exchange Group, Inc. Tokyo Stock Exchange, Inc. Nikkei Inc. Published: May 22, 2015 DISCLAIMER: This translation may be used for reference purposes only. This English version is not an official translation of the original Japanese document. In cases where any differences occur between the English version and the original Japanese version, the Japanese version shall prevail. This translation is subject to change without notice. Japan Exchange Group, Inc., Tokyo Stock Exchange, Inc., Nikkei Inc. and/or their affiliates shall individually or jointly accept no responsibility or liability for damage or loss caused by any error, inaccuracy, misunderstanding, or changes with regard to this translation. Copyright©2015- by Japan Exchange Group, Inc., Tokyo Stock Exchange, Inc., and Nikkei Inc. All rights reserved 1 Table of Contents Introduction..................................................................................................................................... 3 Ⅰ. Outline of the Index................................................................................................................ 4 Ⅱ. Index Calculation.................................................................................................................... 5 1. JPX-Nikkei ...
1 May 22, 2015 Japan Exchange Group, Inc. Nikkei Inc. Start of Calculation and Publication of JPX-Nikkei 400 Leveraged and Inverse Index Japan Exchange Group, Inc. and Tokyo Stock Exchange, Inc. (collectively,“the JPX group”) and Nikkei Inc. (“Nikkei”) will launch the leveraged and inverse indices of the JPX-Nikkei Index 400, which was launched on January 6, 2014. The publication of the new indices is intended to provide the benchmarks, based on the JPX-Nikkei 400, to evaluate various types of investment strategies such as leveraging or hedging. 1. Outline Name 1. JPX-Nikkei 400 Leveraged (2x) Index 2. JPX-Nikkei 400 Inverse (-1x) Index 3. JPX-Nikkei 400 Double Inverse (-2x) Index Calculation Method Please refer to“JPX-Nikkei 400 Leveraged and Inverse Index Guidebook”. Start of Calculation & Publication August 3, 2015 (Scheduled Date) Real-time dissemination (per 15 sec.) of the index via Tokyo Stock Exchange’...
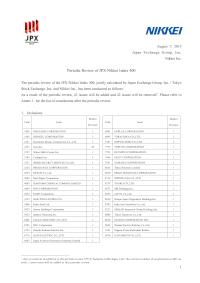
1 August 7, 2015 Japan Exchange Group, Inc. Nikkei Inc. Periodic Review of JPX-Nikkei Index 400 The periodic review of the JPX-Nikkei Index 400, jointly calculated by Japan Exchange Group, Inc. / Tokyo Stock Exchange, Inc. and Nikkei Inc., has been conducted as follows. As a result of the periodic review, 43 issues will be added and 42 issues will be removed1. Please refer to Annex 1. for the list of constituents after the periodic review. 1. Inclusions Code Issue Market Division Code Issue Market Division 1802 OBAYASHI CORPORATION 1 6961 ENPLAS CORPORATION 1 1803 SHIMIZU CORPORATION 1 6995 TOKAI RIKA CO.,LTD. 1 1821 Sumitomo Mitsui Construction Co., Ltd. 1 7287 NIPPON SEIKI CO.,LTD. 2 2121 mixi,Inc. M 7732 TOPCON CORPORATION 1 2127 Nihon M&A Center Inc. 1 7733 OLYMPUS CORPORATION 1 2193 Cookpad Inc. 1 7846 PILOT CORPORATION 1 2331 SOHGO SECURITY SERVICES CO.,...
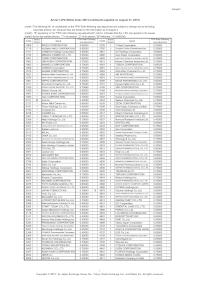
Annex1. (note1) The following No. of constituents or the FFW Ratio following cap-adjustment are subject to change due to de-listing, corporate actions, etc. because they are based on the information as of August 4. (note2) "$" appearing in the "FFW ratio following cap-adjustment" column indicates that the 1.5% cap applies to the issues. (note3) As for the market division, "1"=1st section, "2"=2nd section, "M"=Mothers, "J"=JASDAQ. Code Market Division Issue Code Market Division Issue 1605 1 INPEX CORPORATION 0.65000 3738 1 T-Gaia Corporation 0.20000 1719 1 HAZAMA ANDO CORPORATION 0.65000 3765 J GungHo Online Entertainment,Inc. 0.35000 1721 1 COMSYS Holdings Corporation 0.55000 3861 1 Oji Holdings Corporation 0.65000 1722 1 MISAWA HOMES CO.,LTD. 0.55000 3880 1 Daio Paper Corporation 0.50000 1801 1 TAISEI CORPORATION 0.80000 4005 1 SUMITOMO CHEMICAL COMPANY,LIMITED 0....
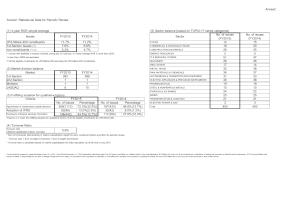
Annex2. Annex2. Referencial Data for Periodic Review (1) 3-year ROE simple average (5) Sector balance (based on TOPIX-17 series categories) Issues FY2015 FY2014 Sector No. of issues (FY2015) No. of issues (FY2014) JPX-Nikkei 400 constituents 11.7% 11.2% FOODS 14 15 1st Section Issues (*1) 7.6% 6.8% COMMERCIAL & WHOLESALE TRADE 18 20 non-constituents (*1,*2) 5.3% 4.7% CONSTRUCTION & MATERIALS 26 25 *1 Issues with liabilities in excess of assets during any of 3 periods, or 3-year average ROE is more than 200% ENERGY RESOURCES 2 5 or less than -200% are excluded. IT & SERVICES, OTHERS 51 47 *2 All the eligible constituents for JPX-Nikkei 400 excluding the JPX-Nikkei 400 constituents. MACHINERY 26 28 REAL ESTATE 17 14 (2) Market division balance RETAIL TRADE 32 38 Market FY2015 FY2014 RAW MATERIALS & CHEMICALS 36 37 1st Section 392 388 AUTOMOBILES & ...
Annex.3 This document is prepared by Japan Exchange Group, Inc. (JPX), Tokyo Stock Exchange, Inc. (TSE) (hereinafter collectively called“the JPX group”) and Nikkei Inc. (Nikkei) solely for the understanding of JPX-Nikkei 400, and is not to be construed as a solicitation for trading any securities or related financial instruments. JPX Group and Nikkei shall accept no liability or responsibility for any loss or damage arising from errors, delays, or termination of the calculation or publication of JPX-Nikkei 400, changes to its calculation or publication method, the use of JPX-Nikkei 400 or all or any part of this document or other similar events. Copyright©2015- by Japan Exchange Group, Inc., Tokyo Stock Exchange, Inc., and Nikkei Inc. All rights reserved Annex 3. Outline of JPX-Nikkei Index 400(Please refer to the guidebook for more details.) Name JPX-Nikkei Index 400 Abbrev.: JPX-Nikkei 400 No....

JPX-Nikkei Index 400 Guidebook June 2, 2016 Japan Exchange Group, Inc. Tokyo Stock Exchange, Inc. Nikkei Inc. Published: June 2, 2016 DISCLAIMER: This translation may be used for reference purposes only. This English version is not an official translation of the original Japanese document. In cases where any differences occur between the English version and the original Japanese version, the Japanese version shall prevail. This translation is subject to change without notice. Japan Exchange Group, Inc., Tokyo Stock Exchange, Inc., Nikkei Inc. and/or their affiliates shall individually or jointly accept no responsibility or liability for damage or loss caused by any error, inaccuracy, misunderstanding, or changes with regard to this translation. (Reference Translation) 1 Copyright©2016- by Japan Exchange Group, Inc., Tokyo Stock Exchange, Inc., and Nikkei Inc. All rights reserved Table of Contents Introduction............................................................................................................................3 I. Outline of the Index............................................................................................................4 II. Index Calculation...............................................................................................................5 1. Outline................................................................................................................................

1 August 5, 2016 Japan Exchange Group, Inc. Nikkei Inc. Periodic Review of JPX-Nikkei Index 400 The periodic review of the JPX-Nikkei Index 400, jointly calculated by Japan Exchange Group, Inc. / Tokyo Stock Exchange, Inc. and Nikkei Inc., has been conducted as follows. As a result of the periodic review, 34 issues will be added and 33 issues will be removed1. Please refer to Annex 1. for the list of constituents after the periodic review. 1. Inclusions Code Issue Market Division Code Issue Market Division 1332 Nippon Suisan Kaisha,Ltd. 1 6723 Renesas Electronics Corporation 1 1720 TOKYU CONSTRUCTION CO., LTD. 1 6750 ELECOM CO.,LTD. 1 1861 Kumagai Gumi Co.,Ltd. 1 7148 Financial Products Group Co.,Ltd. 1 1883 MAEDA ROAD CONSTRUCTION CO.,LTD. 1 7164 ZENKOKU HOSHO Co.,Ltd. 1 1959 KYUDENKO CORPORATION 1 7173 Tokyo TY Financial Group,Inc. 1 2206 EZAKI GLICO CO.,...

Annex1. (note1) The following No. of constituents or the FFW Ratio following cap-adjustment are subject to change due to de-listing, corporate actions, etc. because they are based on the information as of August 4. (note2) "$" appearing in the "FFW ratio following cap-adjustment" column indicates that the 1.5% cap applies to the issues. (note3) As for the market division, "1"=1st section, "2"=2nd section, "M"=Mothers, "J"=JASDAQ. Code Market Division Issue Code Market Division Issue 1332 1 Nippon Suisan Kaisha,Ltd. 0.75000 3382 1 Seven & I Holdings Co.,Ltd. 0.75000 1605 1 INPEX CORPORATION 0.65000 3391 1 TSURUHA HOLDINGS INC. 0.75000 1719 1 HAZAMA ANDO CORPORATION 0.65000 3398 1 KUSURI NO AOKI CO.,LTD. 0.45000 1720 1 TOKYU CONSTRUCTION CO., LTD. 0.55000 3402 1 TORAY INDUSTRIES,INC. 0.75000 1721 1 COMSYS Holdings Corporation 0.55000 3405 1 ...

Annex2 Annex2. Referencial Data for Periodic Review (1) 3-year ROE simple average (5) Sector balance (based on TOPIX-17 series categories) Issues FY2016 FY2015 Sector No. of issues (FY2016) No. of issues (FY2015) JPX-Nikkei 400 constituents 12.5% 11.7% FOODS 16 14 1st Section Issues (*1) 8.2% 7.6% COMMERCIAL & WHOLESALE TRADE 19 18 non-constituents (*1,*2) 5.7% 5.3% CONSTRUCTION & MATERIALS 29 26 *1 Issues with liabilities in excess of assets during any of 3 periods, or 3-year average ROE is more than 200% ENERGY RESOURCES 1 2 or less than -200% are excluded. IT & SERVICES, OTHERS 50 51 *2 All the eligible constituents for JPX-Nikkei 400 excluding the JPX-Nikkei 400 constituents. MACHINERY 27 26 REAL ESTATE 18 17 (2) Market division balance RETAIL TRADE 33 32 Market FY2016 FY2015 RAW MATERIALS & CHEMICALS 36 36 1st Section 395 392 AUTOMOBILES & ...