


Search results 5661-5670 / 10638
- sort:
- relevance
- latest
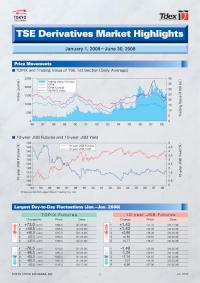
1 July 2008 January 1, 2008~June 30, 2008 10-year JGB Futures Up 1 1 3 4 5 Down 1 2 3 4 5 TOPIX Futures Up 1 2 3 4 4 Down 1 2 3 3 5 ■TOPIX and Trading Value of TSE 1st Section(Daily Average) ■10-year JGB Futures and 10-year JGB Yield TSE Derivatives Market Highlights Price Movements Largest Day-to-Day Fluctuations (Jan.~Jun. 2008) (01.25.08) (04.02.08) (02.14.08) (01.23.08) (02.21.08) 1356.0 1285.5 1337.5 1250.5 1338.0 (+5.7%) (+4.0%) (+3.6%) (+3.1%) (+2.9%) +73.0 +49.5 +46.0 +37.5 +37.5 (01.22.08) (02.06.08) (01.04.08) (01.28.08) (03.17.08) 1213.0 1291.0 1405.0 1291.0 1135.5 (-5.9%) (-4.9%) (-4.4%) (-4.8%) (-...
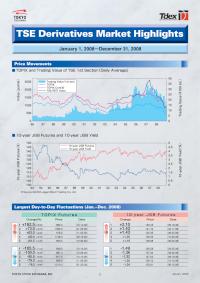
1 January 2009 40 35 30 25 20 15 10 5 0 2500 2000 1500 1000 500 0 96 97 98 99 00 01 02 03 04 05 06 07 08 5 4.5 4 3.5 3 2.5 2 1.5 1 0.5 0 150 145 140 135 130 125 120 115 110 105 100 93 94 95 96 97 98 99 00 01 02 03 04 05 06 07 08 January 1, 2008~December 31, 2008 10-year JGB Futures Up 1 2 2 4 5 Down 1 2 3 4 5 TOPIX Futures Up 1 2 3 4 5 Down 1 2 3 4 5 ■TOPIX and Trading Value of TSE 1st Section(Daily Average) TSE Derivatives Market Highlights Price Movements Largest Day-to-Day Fluctuations (Jan.~Dec. 2008) (10.14.08) (01.25.08) (11.05.08) (09.19.08) (10.30.08) 980....
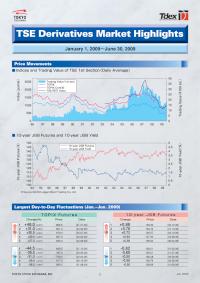
1 July 2009 40 35 30 25 20 15 10 5 0 2500 2000 1500 1000 500 0 96 97 98 99 00 01 02 03 04 05 06 07 08 09 5 4.5 4 3.5 3 2.5 2 1.5 1 0.5 0 150 145 140 135 130 125 120 115 110 105 100 93 94 95 96 97 98 99 00 01 02 03 04 05 06 07 08 09 January 1, 2009~June 30, 2009 10-year JGB Futures Up 1 2 3 4 5 Down 1 2 3 3 5 TOPIX Futures Up 1 2 3 4 5 Down 1 2 3 4 5 ■Indices and Trading Value of TSE 1st Section(Daily Average) TSE Derivatives Market Highlights Price Movements Largest Day-to-Day Fluctuations (Jan.~Jun. 2009) (01.27.09) (04.30.09) (05.07.09) (04.02.09) (04.09....
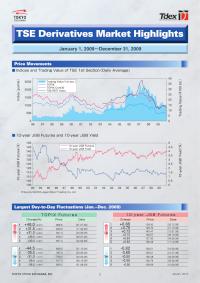
1 January 2010 40 35 30 25 20 15 10 5 0 2500 2000 1500 1000 500 0 5 4.5 4 3.5 3 2.5 2 1.5 1 0.5 0 150 145 140 135 130 125 120 115 110 105 100 96 97 98 99 00 01 02 03 04 05 06 07 08 09 93 94 95 96 97 98 99 00 01 02 03 04 05 06 07 08 09 January 1, 2009~December 31, 2009 10-year JGB Futures Up 1 2 3 4 5 5 Down 1 2 3 3 5 TOPIX Futures Up 1 2 3 4 5 Down 1 2 3 4 5 ■Indices and Trading Value of TSE 1st Section(Daily Average) TSE Derivatives Market Highlights Price Movements Largest Day-to-Day Fluctuations (Jan.~Dec. 2009) (01.27.09) (11.30.09) (04.30.09) (05.07.09) (04....
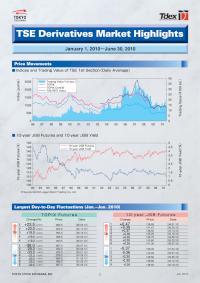
1 July 2010 40 35 30 25 20 15 10 5 0 2500 2000 1500 1000 500 0 5 4.5 4 3.5 3 2.5 2 1.5 1 0.5 0 150 145 140 135 130 125 120 115 110 105 100 96 97 98 99 00 01 02 03 04 05 06 07 08 09 10 93 94 95 96 97 98 99 00 01 02 03 04 05 06 07 08 09 10 January 1, 2010~June 30, 2010 10-year JGB Futures Up 1 2 3 4 5 5 5 Down 1 2 3 4 5 TOPIX Futures Up 1 2 3 4 4 Down 1 2 3 4 5 5 5 ■Indices and Trading Value of TSE 1st Section(Daily Average) TSE Derivatives Market Highlights Price Movements Largest Day-to-Day Fluctuations (Jan.~Jun. 2010) (06.03.10) (02.17.10) (06.16....
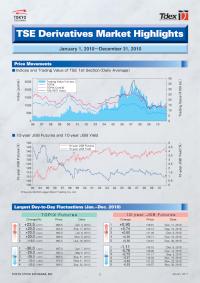
1 January 2011 40 35 30 25 20 15 10 5 0 2500 2000 1500 1000 500 0 5 4.5 4 3.5 3 2.5 2 1.5 1 0.5 0 150 145 140 135 130 125 120 115 110 105 100 96 97 98 99 00 01 02 03 04 05 06 07 08 09 10 93 94 95 96 97 98 99 00 01 02 03 04 05 06 07 08 09 10 January 1, 2010~December 31, 2010 10-year JGB Futures 1 2 3 4 5 Down Down 1 2 3 4 5 5 TOPIX Futures Up Up 1 2 2 2 5 1 2 3 4 4 ■Indices and Trading Value of TSE 1st Section(Daily Average) TSE Derivatives Market Highlights Price Movements Largest Day-to-Day Fluctuations (Jan.~Dec. 2010) (Jun. 3, 2010) (Feb. 17, 2010) (Jul. 8, 2010) (Nov. 5, ...
1 July 2011 40� 35� 30� 25� 20� 15� 10� 5� 0 2500� 2000� 1500� 1000� 500� 0 5� 4.5� 4� 3.5� 3� 2.5� 2� 1.5� 1� 0.5� 0 150� 145� 140� 135� 130� 125� 120� 115� 110� 105� 100 96 97 98 99 00 01 02 03 04 05 06 07 08 09 10 11 93 94 95 96 97 98 99 00 01 02 03 04 05 06 07 08 09 10 11 January 1, 2011~June 30, 2011 10-year JGB Futures 1� 2� 3� 4� 5 Down Down 1� 2� 3� 4� 5 TOPIX Futures Up Up 1� 2...
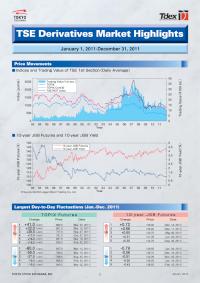
1 January 2012 40 35 30 25 20 15 10 5 0 2500 2000 1500 1000 500 0 5 4.5 4 3.5 3 2.5 2 1.5 1 0.5 0 150 145 140 135 130 125 120 115 110 105 100 93 94 95 96 97 98 99 00 01 Year Year 02 03 04 05 06 07 08 09 10 11 93 94 95 96 97 98 99 00 01 02 03 04 05 06 07 08 09 10 11 January 1, 2011-December 31, 2011 10-year JGB Futures 1 2 3 4 5 Down Down 1 2 3 4 5 TOPIX Futures Up Up 1 2 3 4 5 5 1 2 3 4 5 ■Indices and Trading Value of TSE 1st Section(Daily Average) TSE Derivatives Market Highlights Price Movements Largest Day-to-Day Fluctuations (Jan.-Dec. 2011) (Mar. 22, 2011) (Mar....
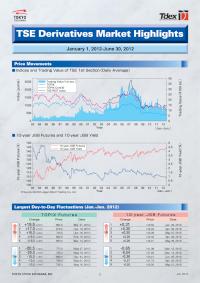
1 July 2012 40 35 30 25 20 15 10 5 0 2500 2000 1500 1000 500 0 5 4.5 4 3.5 3 2.5 2 1.5 1 0.5 0 150 145 140 135 130 125 120 115 110 105 100 Year Year(Jan.-Jun.) 93 94 95 96 97 98 99 00 01 02 03 04 05 06 07 08 09 10 11 12 93 94 95 96 97 98 99 00 01 02 03 04 05 06 07 08 09 10 11 12 January 1, 2012-June 30, 2012 10-year JGB Futures 1 2 3 4 5 Down Down 1 2 3 4 5 TOPIX Futures Up Up 1 2 3 4 4 1 2 3 4 5 ■Indices and Trading Value of TSE 1st Section(Daily Average) TSE Derivatives Market Highlights Price Movements Largest Day-to-Day Fluctuations (Jan.-Jun. 2012) (Mar....
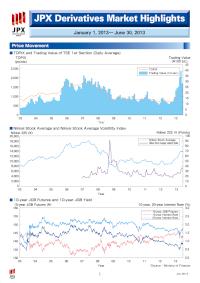
July, 2013 July, 2013 July, 2013 6 1 5 JPX Derivatives Market Highlights January 1, 2013~June 30, 2013 Price Movement Trading Data (Jan.-Jun. 2013) Contact Trading Records Contract Specifications Trading Fees (as of July 16, 2013) ■TOPIX and Trading Value of TSE 1st Section (Daily Average) Trading Value (¥100 bil.) TOPIX (points) Year TOPIX Trading Value (1st sec.) 45 40 35 30 25 20 15 10 50 03 04 05 06 07 08 09 10 11 12 13 2,500 2,000 1,500 1,000 500 0 ■Nikkei Stock Average and Nikkei Stock Average Volatility Index 100 90 80 70 60 50 40 30 20 10 0 Year 03 04 05 06 07 08 09 10 11 12 13 Nikkei Stock Average Nikkei Stock Average Volatility Index Nikkei 225 VI (Points) Nikkei 225 (¥) 20,000 18,000 16,000 14,000 12,000 10,000 8,000...