


Search results 5671-5680 / 10648
- sort:
- relevance
- latest
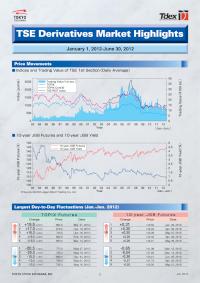
1 July 2012 40 35 30 25 20 15 10 5 0 2500 2000 1500 1000 500 0 5 4.5 4 3.5 3 2.5 2 1.5 1 0.5 0 150 145 140 135 130 125 120 115 110 105 100 Year Year(Jan.-Jun.) 93 94 95 96 97 98 99 00 01 02 03 04 05 06 07 08 09 10 11 12 93 94 95 96 97 98 99 00 01 02 03 04 05 06 07 08 09 10 11 12 January 1, 2012-June 30, 2012 10-year JGB Futures 1 2 3 4 5 Down Down 1 2 3 4 5 TOPIX Futures Up Up 1 2 3 4 4 1 2 3 4 5 ■Indices and Trading Value of TSE 1st Section(Daily Average) TSE Derivatives Market Highlights Price Movements Largest Day-to-Day Fluctuations (Jan.-Jun. 2012) (Mar....
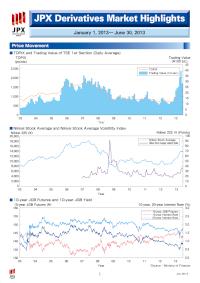
July, 2013 July, 2013 July, 2013 6 1 5 JPX Derivatives Market Highlights January 1, 2013~June 30, 2013 Price Movement Trading Data (Jan.-Jun. 2013) Contact Trading Records Contract Specifications Trading Fees (as of July 16, 2013) ■TOPIX and Trading Value of TSE 1st Section (Daily Average) Trading Value (¥100 bil.) TOPIX (points) Year TOPIX Trading Value (1st sec.) 45 40 35 30 25 20 15 10 50 03 04 05 06 07 08 09 10 11 12 13 2,500 2,000 1,500 1,000 500 0 ■Nikkei Stock Average and Nikkei Stock Average Volatility Index 100 90 80 70 60 50 40 30 20 10 0 Year 03 04 05 06 07 08 09 10 11 12 13 Nikkei Stock Average Nikkei Stock Average Volatility Index Nikkei 225 VI (Points) Nikkei 225 (¥) 20,000 18,000 16,000 14,000 12,000 10,000 8,000...
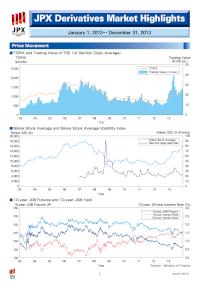
January, 2014 January, 2014 January, 2014 6 1 5 JPX Derivatives Market Highlights January 1, 2013~December 31, 2013 Price Movement Trading Data (Jan.-Dec. 2013) Contact Trading Records Contract Specifications Trading Fees (as of Dec. 2013) ■TOPIX and Trading Value of TSE 1st Section (Daily Average) Trading Value (¥100 bil.) TOPIX (points) Year TOPIX Trading Value (1st sec.) 50 40 30 20 10 0 2,500 2,000 1,500 1,000 500 0 03 04 05 06 07 08 09 10 11 12 13 ■Nikkei Stock Average and Nikkei Stock Average Volatility Index 100 90 80 70 60 50 40 30 20 10 0 Year Nikkei Stock Average Nikkei Stock Average Volatility Index Nikkei 225 VI (Points) Nikkei 225 (¥) 20,000 18,000 16,000 14,000 12,000 10,000 8,000 6,000 4,000 2,000 0 03 04 05 06 07 08 09 10 ...
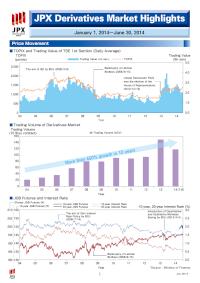
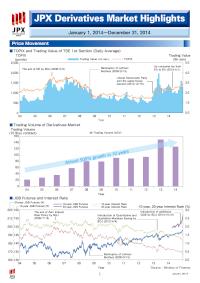
July, 2014 1 JPX Derivatives Market Highlights January 1, 2014~June 30, 2014 Price Movement ■TOPIX and Trading Value of TSE 1st Section (Daily Average) 04 05 06 07 08 09 10 11 12 13 14 Trading Value (tln yen) TOPIX (points) Year 5.0 4.0 3.0 2.0 1.0 0.0 2,500 2,000 1,500 1,000 500 0 The exit of QE by BOJ (2006/3/9) Bankruptcy of Lehman Brothers (2008/9/15) Liberal Democratic Party won the election of the House of Representatives (2012/12/16) Trading Value (1st sec.) TOPIX ■Trading Volume of Derivatives Market Year 0 20 40 60 80 100 120 140 160 04 05 06 07 08 09 10 11 12 13 14(1-6) Trading Volume (10 thou contract) Trading Volume (ADV)More than 450% growth in 10 years■JGB Futures and Interest Rate 3.0...
January, 2015 1 JPX Derivatives Market Highlights January 1, 2014~December 31, 2014 Price Movement ■TOPIX and Trading Value of TSE 1st Section (Daily Average) 04 05 06 07 08 09 10 11 12 13 14 Trading Value (tln yen) TOPIX (points) Year Trading Value (1st sec.) TOPIX The exit of QE by BOJ (2006/3/9) Bankruptcy of Lehman Brothers (2008/9/15) Liberal Democratic Party won the upper-house election (2012/12/16) Up consumer tax from 5% to 8% (2014/4/1) 2,500 2,000 1,500 1,000 500 0 5.0 4.0 3.0 2.0 1.0 0.0 ■Trading Volume of Derivatives Market Year 0 20 40 60 80 100 120 140 160 04 05 06 07 08 09 10 11 12 13 14 Trading Volume (10 thou contract) Trading Volume (ADV)Almost 500% growth in 10 years■JGB Futures and ...
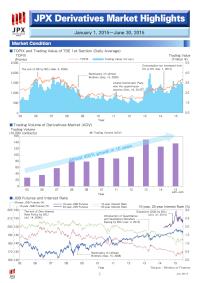
July, 2015 1 JPX Derivatives Market Highlights January 1, 2015~June 30, 2015 Market Condition ■TOPIX and Trading Value of TSE 1st Section (Daily Average) 05 06 07 08 09 10 11 12 13 14 15 Trading Value (Trillion¥) TOPIX (Points) Year Trading Value (1st sec.) TOPIX 2,500 2,000 1,500 1,000 500 0 5.0 4.0 3.0 2.0 1.0 0.0 The exit of QE by BOJ (Mar. 9, 2006) Bankruptcy of Lehman Brothers (Sep. 15, 2008) Liberal Democratic Party won the upper-house election (Dec. 16, 2012) Consumption tax increased from 5% to 8% (Apr. 1, 2014) ■Trading Volume of Derivatives Market (ADV) Year 0 20 40 60 80 100 120 140 160 Trading Volume (10,000 contracts) Trading Volume (ADV) 05 06 07 08 09 10 11 12 13 14 15 Jan.-Jun.Almost 400% growth in 10 years■JGB ...
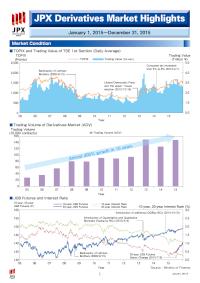
January, 2016 1 JPX Derivatives Market Highlights January 1, 2015~December 31, 2015 Market Condition ■TOPIX and Trading Value of TSE 1st Section (Daily Average) 05 06 07 08 09 10 11 12 13 14 15 Trading Value (Trillion¥) TOPIX (Points) Year Trading Value (1st sec.) TOPIX 2,500 2,000 1,500 1,000 500 0 5.0 4.0 3.0 2.0 1.0 0.0 Bankruptcy of Lehman Brothers (2008/9/15) Liberal Democratic Party won the upper‐house election (2012/12/16) Consumer tax increased from 5% to 8% (2014/4/1) ■Trading Volume of Derivatives Market (ADV) Year 0 20 40 60 80 100 120 140 160 Trading Volume (10,000 contracts) Trading Volume (ADV) 05 06 07 08 09 10 11 12 13 14 15Almost 400% growth in 10 years■JGB Futures and Interest Rate 3.0 2.5 2.0 1.5...
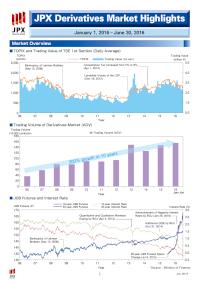
July, 2016 1 JPX Derivatives Market Highlights January 1, 2016 - June 30, 2016 Market Overview ■TOPIX and Trading Value of TSE 1st Section (Daily Average) 06 07 08 09 10 11 12 13 14 15 16 Trading Value (trillion¥) TOPIX (points) Year Trading Value (1st sec.) TOPIX 2,500 2,000 1,500 1,000 500 0 5.0 4.0 3.0 2.0 1.0 0.0 Bankruptcy of Lehman Brothers (Sep 15, 2008) Landslide Victory of the LDP (Dec 16, 2012) Consumption Tax Increased from 5% to 8% (Apr 1, 2014) ■Trading Volume of Derivatives Market (ADV) Year Trading Volume (10,000 contracts) Trading Volume (ADV)300% growth in 10 yearsJan-Jun 0 20 40 60 80 100 120 140 180 160 06 07 08 09 10 11 12 13 14 15 16 ■JGB Futures and Interest Rate 3.0 2.5 2.0 1.5 1....
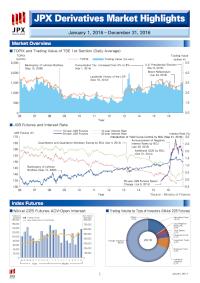
January, 2017 1 JPX Derivatives Market Highlights 0 100,000 200,000 300,000 400,000 500,000 600,000 700,000 800,000020,000 40,000 120,000 140,000 160,000 100,000 80,000 60,000 180,000 06 07 08 09 10 11 12 13 14 15 1 2 3 4 5 6 7 8 9 10 11 12 ■Nikkei 225 Futures ADV・Open Interest■Trading Volume by Type of Investors (Nikkei 225 Futures) Year Month Trading Volume Open Interest (End of Year/Month) Trading Vol. (contracts) Open Interest (contracts) Index Futures 2016 Securities Firms 15.0% Others 0.2% Foreign Investors 68.2% Trust Banks 2.2% Investment Trusts 4.4% Business Firms 0.4% Individual Investors 8.7% City/Regional Banks,etc. 0.8% Insurance Firms 0.1% January 1, 2016 - December 31, 2016 Market Overview ■TOPIX and Trading Value of TSE 1st Section (...
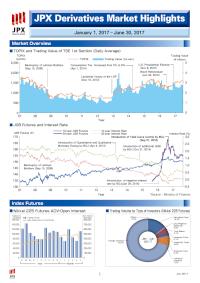
July, 2017 1 JPX Derivatives Market Highlights 0 100,000 200,000 300,000 400,000 500,000 600,000 700,000 800,000020,000 40,000 120,000 140,000 100,000 80,000 60,000 160,000 07 08 09 10 11 12 13 14 15 16 1 2 3 4 5 6 ■Nikkei 225 Futures ADV・Open Interest■Trading Volume by Type of Investors (Nikkei 225 Futures) Year Month Trading Volume Open Interest (End of Year/Month) Trading Vol. (contracts) Open Interest (contracts) Index Futures Jan - Jun 2017 Securities Firms 14.4% Others 0.2% Foreign Investors 70.7% Trust Banks 2.1% Investment Trusts 4.0% Business Firms 0.4% Individual Investors 7.5% City/Regional Banks,etc. 0.8% Insurance Firms 0.1% January 1, 2017 - June 30, 2017 Market Overview ■TOPIX and Trading Value of TSE 1st Section (Daily Average) 07 08 09 10 ...