


Search results 7781-7790 / 10648
- sort:
- relevance
- latest
Exchange & beyond ©2022 Japan Exchange Group, Inc. Data and Digital Services JPX IR Day 2022 President & CEO, JPX Market Innovation & Research, Inc. Miyahara Koichiro July 5, 2022 ©2022 Japan Exchange Group, Inc. About JPX Market Innovation & Research, Inc. 2 ©2022 Japan Exchange Group, Inc. Establishment of JPX Market Innovation & Research, Inc. 3 Japan Exchange Group, Inc. (JPX) has established a new company, JPX Market Innovation & Research, Inc. (JPXI), to play a central role in our strategic business development. JPXI started business on April 1, 2022. JPX Market Innovation & Research Data and Digital Business Japan Exchange Regulation Osaka Exchange Japan Securities Clearing Corporation Japan Exchange Group Tokyo Commodity Exchange Cash Equity Market Operations Self-Regulation Derivative Market Operations Clearing House New business DX, digitalization Index and data services IT solutions Tokyo Stock Exchange Integration of the Group’s data and digital businesses Fostering a new culture without being constrained by the “...
2022 Japan Exchange Group, Inc. Exchange & beyond Derivatives Market JPX IR Day 2022 IWANAGA Moriyuki President & CEO, Osaka Exchange, Inc. Representative Director & Chair, Chairperson of the Board, Tokyo Commodity Exchange, Inc. July 5, 2022 ©2022 Japan Exchange Group, Inc. Market Environment ©2022 Japan Exchange Group, Inc. Overview of Derivatives Market - Overall Trading Volume - 3 - Derivatives trading volume is strongly influenced by market conditions and has a strong correlation with volatility. - In the first half of FY2021, trading was calm with low and stable levels of volatility. However, towards the end of FY2021, trading became more active due to Russia’s invasion of Ukraine, pushing average daily trading volume for FY2021 to 1.44 million contracts. 0 500 1,000 1,500 2,000 2,500 3,000 FY2011 Q1 FY2012 Q1 FY2013 Q1 FY2014 Q1 FY2015 Q1 FY2016 Q1 FY2017 Q1 FY2018 Q1 FY2019 Q1 FY2020 Q1 FY2021 Q1 FY2022...
2022 Japan Exchange Group, Inc. Exchange & beyond Cash Equity Market JPX IR Day 2022 Yamaji Hiromi President & CEO Tokyo Stock Exchange, Inc. July 5, 2022 ©2022 Japan Exchange Group, Inc. Listing Services ©2022 Japan Exchange Group, Inc. Overview of New Market Segments New Market Segments (Market Concepts) For companies which have appropriate levels of market capitalization (liquidity) to be investment instruments for many institutional investors, keep a higher quality of corporate governance, and commit to sustainable growth and improvement of medium- to long- term corporate value, putting constructive dialogue with investors at the center Prime Market For companies which have appropriate levels of market capitalization (liquidity) to be investment instruments in the open market, keep the basic level of corporate governance expected of listed companies, and commit to sustainable growth and improvement of medium- to long- term corporate value Standard Market 3 For companies which have a certain level of ...
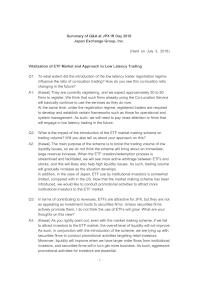
- 1 - Summary of Q&A at JPX IR Day 2018 Japan Exchange Group, Inc. (Held on July 3, 2018) Vitalization of ETF Market and Approach to Low Latency Trading Q1: To what extent did the introduction of the low latency trader registration regime influence the ratio of co-location trading? How do you see this co-location ratio changing in the future? A1: (Kawai) They are currently registering, and we expect approximately 50 to 60 firms to register. We think that such firms already using the Co-Location Service will basically continue to use the services as they do now. At the same time, under the registration regime, registered traders are required to develop and establish certain frameworks such as those for operational and system management. As such, we will need to pay close attention to firms that will engage in low latency trading in the future. Q2: What ...
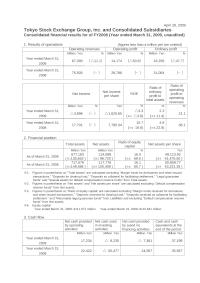
April 28, 2009 Tokyo Stock Exchange Group, Inc. and Consolidated Subsidiaries Consolidated financial results for of FY2008 (Year ended March 31, 2009, unaudited) 1. Results of operations (figures less than a million yen are omitted) Operating revenues Operating profit Ordinary profit Million Yen % Million Yen % Million Yen % Year ended March 31, 2009 67,090(△11.1)14,174(△50.8)16,259(△47.7) Year ended March 31, 2008 75,505(-)28,786(-)31,064(-) Net income Net income per share ROE Ratio of ordinary profit to total assets Ratio of operating profit to operating revenues Milion Yen % Yen % % % Year ended March 31, 2009 △3,696(-)△1,625.65 △3.3 (※2△3.8) 2.3 (※3 11.4) 21.1 Year ended March 31, 2008 17,701(-)7,785.04 15.7 (※2 18.6) 4.8 (※3 22.8) 38.1 2. Financial position Total assets Net assets...
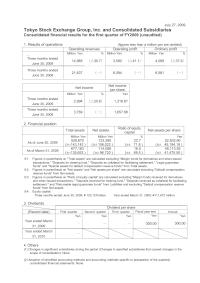
July 27, 2009 Tokyo Stock Exchange Group, Inc. and Consolidated Subsidiaries Consolidated financial results for the first quarter of FY2009 (unaudited) 1. Results of operations (figures less than a million yen are omitted) Operating revenues Operating profit Ordinary profit Three months ended Million Yen % Million Yen % Million Yen % Three months ended June 30, 2009 14,985(△30.7)3,590(△41.1)4,089(△37.9) Three months ended June 30, 2008 21,637(-)6,094(-)6,581(-) Net income Net income per share Million Yen % Yen Three months ended June 30, 2009 2,994(△20.6)1,316.87 Three months ended June 30, 2008 3,769(-)1,657.68 2. Financial position Total assets Net assets Ratio of equity capital Net assets per share Million Yen Million Yen % Yen As of June 30, 2009 529,870 (※1143,142 ) 123,390 (※2 106,022 ) 22.7 (※3 71.8 )...
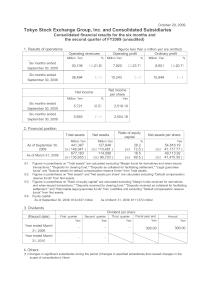
October 29, 2009 Tokyo Stock Exchange Group, Inc. and Consolidated Subsidiaries Consolidated financial results for the six months and the second quarter of FY2009 (unaudited) 1. Results of operations (figures less than a million yen are omitted) Operating revenues Operating profit Ordinary profit Three months ended Million Yen % Million Yen % Million Yen % Six months ended September 30, 2009 30,108(△21.8)7,820(△23.7)8,601(△20.7) Six months ended September 30, 2008 38,494(-)10,243(-)10,849(-) Net income Net income per share Million Yen % Yen Six months ended September 30, 2009 5,721(0.5)2,516.19 Six months ended September 30, 2008 5,693(-)2,504.18 2. Financial position Total assets Net assets Ratio of equity capital Net assets per share Million Yen Million Yen % Yen As of September 30, 2009 441,367 (※1 148,041 ) 127,848 (※2 110,481 )...
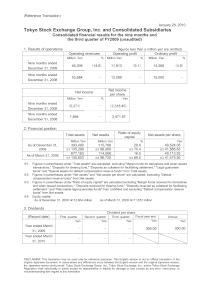
(Reference Translation) DISCLAIMER: This translation may be used only for reference purposes. This English version is not an official translation of the original Japanese document. In cases where any differences occur between the English version and the original Japanese version, the Japanese version shall prevail. Tokyo Stock Exchange Group, Inc., Tokyo Stock Exchange, Inc., and/or Tokyo Stock Exchange Regulation shall individually or jointly accept no responsibility or liability for damage or loss caused by any error, inaccuracy, or misunderstanding with regard to this translation. January 28, 2010 Tokyo Stock Exchange Group, Inc. and Consolidated Subsidiaries Consolidated financial results for the nine months and the third quarter of FY2009 (unaudited) 1. Results of operations (figures less than a million yen are omitted) Operating revenues Operating profit Ordinary profit Three months ended Million Yen % Million Yen % Million Yen % Nine months ended December 31, 2009 46,008(14.6)11,913(...
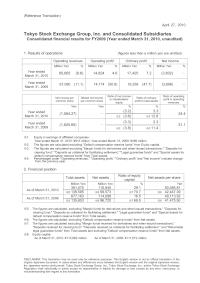
(Reference Translation) DISCLAIMER: This translation may be used only for reference purposes. This English version is not an official translation of the original Japanese document. In cases where any differences occur between the English version and the original Japanese version, the Japanese version shall prevail. Tokyo Stock Exchange Group, Inc., Tokyo Stock Exchange, Inc., and/or Tokyo Stock Exchange Regulation shall individually or jointly accept no responsibility or liability for damage or loss caused by any error, inaccuracy, or misunderstanding with regard to this translation. April 27, 2010 Tokyo Stock Exchange Group, Inc. and Consolidated Subsidiaries Consolidated financial results for FY2009 (Year ended March 31, 2010, unaudited) 1. Results of operations (figures less than a million yen are omitted) Net income per common share Diluted net income per common share Ratio of net income to shareholders’ equity Ratio of ordinary profit to total assets Ratio of operating profit to ...
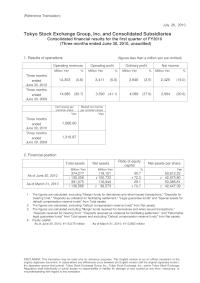
(Reference Translation) DISCLAIMER: This translation may be used only for reference purposes. This English version is not an official translation of the original Japanese document. In cases where any differences occur between the English version and the original Japanese version, the Japanese version shall prevail. Tokyo Stock Exchange Group, Inc., Tokyo Stock Exchange, Inc., and/or Tokyo Stock Exchange Regulation shall individually or jointly accept no responsibility or liability for damage or loss caused by any error, inaccuracy, or misunderstanding with regard to this translation. July 26, 2010 Tokyo Stock Exchange Group, Inc. and Consolidated Subsidiaries Consolidated financial results for the first quarter of FY2010 (Three months ended June 30, 2010, unaudited) 1. Results of operations (figures less than a million yen are omitted) Net income per common share Diluted net income per common share Yen Yen Three months ended June 30, 2010 1,066.60- Three months ended...