


Search results 8031-8040 / 10648
- sort:
- relevance
- latest

2022 Japan Exchange Group, Inc. Overview of Earnings for FY2021 Japan Exchange Group, Inc. April 26, 2022 ©2022 Japan Exchange Group, Inc. Contents Overview of Earnings for FY2021〔IFRS〕1 Reference Materials 2 ©2022 Japan Exchange Group, Inc. I. Overview of Earnings for FY2021〔IFRS〕 (April 1, 2021–March 31, 2022) * This document is not subject to the audit procedures required under the Financial Instruments and Exchange Act. Please note that its contents have not been audited on a consolidated basis in accordance with the Act as of the time of disclosure. ©2022 Japan Exchange Group, Inc. 4 Cash Equities Average Daily Trading Value (April 2019–March 2022) Market Trends (Cash Equities) Daily Average Trading Value by Market Division (JPY) * Total value of daily averages of auction and off-auction trading of common stocks on 1st/2nd Sections, Mothers, JASDAQ, TOKYO PRO Market, and ETFs/ETNs, REITs etc. FY2021 Annual ...

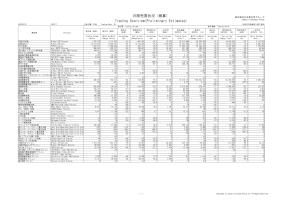
月間売買状況(概算)株式会社日本取引所グループ Trading Overview(Preliminary Estimates) Japan Exchange Group 2022年6月2022/6立会日数:22日Trading Days:22※百万円未満切り捨て表示取引高(単位)前月比(単位) 前月比 (比率) 前年同月比 (単位) 前年同月比 (比率) 一日平均 (単位) 取引金額 (百万円)(※) 前月比 (百万円)(※) 前月比 (比率) 前年同月比 (百万円)(※) 前年同月比 (比率) 一日平均 (百万円)(※) Trading Volume (Units) Month-on-Month Change (Units) percentage (%) Year-on-Year Change(Units) percentage (%) Daily Average (Units) Trading Value (¥...

2022年6月売買状況(概算)(立会日数22日) 現物市場 Cash Equity Markets 内国株式 Domestic Stocks 区分 Market 区分 Volume/Value 当月 This Month 前月比(率) Month-on-Month Change (percentage) 前年同月比(率) Year-on-Year Change (percentage) 1日平均 Daily Average 売買高千株 Trading Volume thous.shares 31,449,400 +985,921 ( +3.2% ) - ( - ) 1,429,518 売買代金100万円 Trading Value mil.yen 74,194,957 +2,641,692 ( +3.7% ) - ( - ) 3,372,498 売買高千株 Trading Volume thous.shares 4,526,235 +491,101 ( +12.2% ) - ( - ) 205,738 売買代金100万円 Trading Value mil.yen 2,140,853 +504,954 ( +30.9% ) - ( - ) 97,312 売買高千株...
月間売買状況(概算)株式会社日本取引所グループ Trading Overview(Preliminary Estimates) Japan Exchange Group 2022年7月2022/7立会日数:20日Trading Days:20※百万円未満切り捨て表示取引高(単位)前月比(単位) 前月比 (比率) 前年同月比 (単位) 前年同月比 (比率) 一日平均 (単位) 取引金額 (百万円)(※) 前月比 (百万円)(※) 前月比 (比率) 前年同月比 (百万円)(※) 前年同月比 (比率) 一日平均 (百万円)(※) Trading Volume (Units) Month-on-Month Change (Units) percentage (%) Year-on-Year Change(Units) percentage (%) Daily Average (Units) Trading Value (¥...
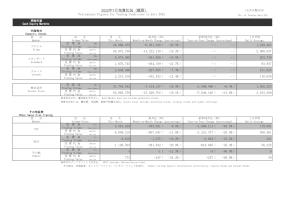
2022年7月売買状況(概算)(立会日数20日) 現物市場 Cash Equity Markets 内国株式 Domestic Stocks 区分 Market 区分 Volume/Value 当月 This Month 前月比(率) Month-on-Month Change (percentage) 前年同月比(率) Year-on-Year Change (percentage) 1日平均 Daily Average 売買高千株 Trading Volume thous.shares 24,988,075 -6,461,326 ( -20.5% ) - ( - ) 1,249,404 売買代金100万円 Trading Value mil.yen 59,972,739 -14,222,218 ( -19.2% ) - ( - ) 2,998,637 売買高千株 Trading Volume thous.shares 4,074,580 -451,656 ( -10.0% ) - ( - ) 203,729 売買代金100万円 Trading Value mil.yen 1,676,745 -464,109 ( -21.7% ) - ( - ) 83,837 売買高千...
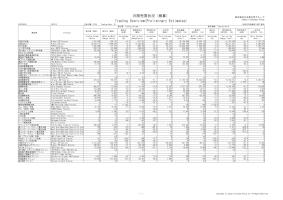
月間売買状況(概算)株式会社日本取引所グループ Trading Overview(Preliminary Estimates) Japan Exchange Group 2022年8月2022/8立会日数:22日Trading Days:22※百万円未満切り捨て表示取引高(単位)前月比(単位) 前月比 (比率) 前年同月比 (単位) 前年同月比 (比率) 一日平均 (単位) 取引金額 (百万円)(※) 前月比 (百万円)(※) 前月比 (比率) 前年同月比 (百万円)(※) 前年同月比 (比率) 一日平均 (百万円)(※) Trading Volume (Units) Month-on-Month Change (Units) percentage (%) Year-on-Year Change(Units) percentage (%) Daily Average (Units) Trading Value (¥...

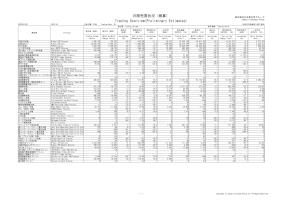
月間売買状況(概算)株式会社日本取引所グループ Trading Overview(Preliminary Estimates) Japan Exchange Group 2022年9月2022/9立会日数:20日Trading Days:20※百万円未満切り捨て表示取引高(単位)前月比(単位) 前月比 (比率) 前年同月比 (単位) 前年同月比 (比率) 一日平均 (単位) 取引金額 (百万円)(※) 前月比 (百万円)(※) 前月比 (比率) 前年同月比 (百万円)(※) 前年同月比 (比率) 一日平均 (百万円)(※) Trading Volume (Units) Month-on-Month Change (Units) percentage (%) Year-on-Year Change(Units) percentage (%) Daily Average (Units) Trading Value (¥...
月間売買状況(概算)株式会社日本取引所グループ Trading Overview(Preliminary Estimates) Japan Exchange Group 2022年10月2022/10立会日数:20日Trading Days:20※百万円未満切り捨て表示取引高(単位)前月比(単位) 前月比 (比率) 前年同月比 (単位) 前年同月比 (比率) 一日平均 (単位) 取引金額 (百万円)(※) 前月比 (百万円)(※) 前月比 (比率) 前年同月比 (百万円)(※) 前年同月比 (比率) 一日平均 (百万円)(※) Trading Volume (Units) Month-on-Month Change (Units) percentage (%) Year-on-Year Change(Units) percentage (%) Daily Average (Units) Trading Value (¥...
月間売買状況(概算)株式会社日本取引所グループ Trading Overview(Preliminary Estimates) Japan Exchange Group 2024年2月2024/2立会日数:19日Trading Days:19※百万円未満切り捨て表示取引高(単位)前月比(単位) 前月比 (比率) 前年同月比 (単位) 前年同月比 (比率) 一日平均 (単位) 取引金額 (百万円)(※) 前月比 (百万円)(※) 前月比 (比率) 前年同月比 (百万円)(※) 前年同月比 (比率) 一日平均 (百万円)(※) Trading Volume (Units) Month-on-Month Change (Units) percentage (%) Year-on-Year Change(Units) percentage (%) Daily Average (Units) Trading Value (¥...
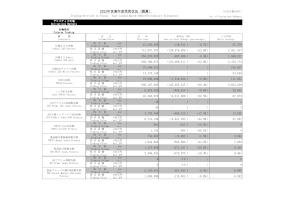
(立会日数244日) デリバティブ市場 Derivatives Markets 先物取引 Futures Trading 種類 Contracts 区分 Volume/Value 当年 This Year 前年比(率) Year-on-Year Change (percentage) 1日平均 Daily Average 取引高単位 Trading Volume Units 21,320,485 -146,813 ( -0.7% ) 87,379 取引金額100万円 Tradin g Value mil.JPY 712,857,357 +128,579,806 ( +22.0% ) 2,921,547 取引高単位 Trading Volume Units 255,276,857 -907,956 ( -0.4% ) 1,046,217 取引金額100万円 Tradin g Value mil.JPY 848,186,674 +153,008,411 ( +22.0% ) 3,476,175 取引高単位 Trading Volume Units 37,808,031 - ( - ) 182,647 取引金額100万円...