


Search results 8051-8060 / 10651
- sort:
- relevance
- latest
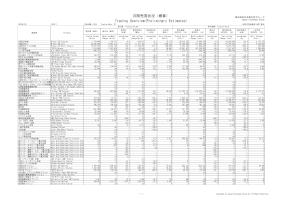
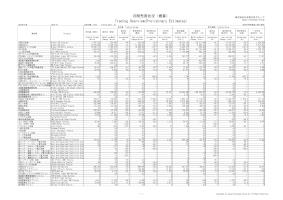
月間売買状況(概算)株式会社日本取引所グループ Trading Overview(Preliminary Estimates) Japan Exchange Group 2024年7月2024/7立会日数:22日Trading Days:22※百万円未満切り捨て表示取引高(単位)前月比(単位) 前月比 (比率) 前年同月比 (単位) 前年同月比 (比率) 一日平均 (単位) 取引金額 (百万円)(※) 前月比 (百万円)(※) 前月比 (比率) 前年同月比 (百万円)(※) 前年同月比 (比率) 一日平均 (百万円)(※) Trading Volume (Units) Month-on-Month Change (Units) percentage (%) Year-on-Year Change(Units) percentage (%) Daily Average (Units) Trading Value (¥...
2024年7月売買状況(概算) (立会日数22日) 現物市場 Cash Equity Markets 内国株式 Domestic Stocks 区分 Market 区分 Volume/Value 当月 This Month 前月比(率) Month-on-Month Chan ge (percentage) 前年同月比(率) Year-on-Year Change (percentage) 1日平均 Daily Average 売買高千株 Trading Volume thous.shares 43,017,693 +6,216,152 ( +16.9% ) +10,983,508 ( +34.3% ) 1,955,350 売買代金100万円 Trading Value mil.yen 108,378,995 +16,898,619 ( +18.5% ) +30,332,383 ( +38.9% ) 4,926,318 売買高千株 Trading Volume thous.shares 7,472,301 -491,322 ( -6.2% ) +1,502,575 ( +25.2% ) 339,650 売買代金100万円 Trading ...
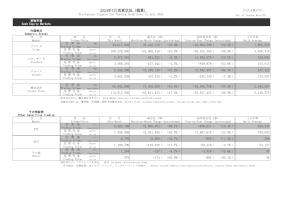
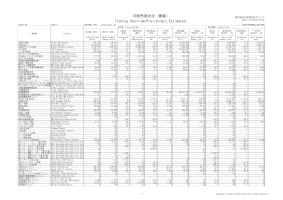
月間売買状況(概算)株式会社日本取引所グループ Trading Overview(Preliminary Estimates) Japan Exchange Group 2024年8月2024/8立会日数:21日Trading Days:21※百万円未満切り捨て表示取引高(単位)前月比(単位) 前月比 (比率) 前年同月比 (単位) 前年同月比 (比率) 一日平均 (単位) 取引金額 (百万円)(※) 前月比 (百万円)(※) 前月比 (比率) 前年同月比 (百万円)(※) 前年同月比 (比率) 一日平均 (百万円)(※) Trading Volume (Units) Month-on-Month Change (Units) percentage (%) Year-on-Year Change(Units) percentage (%) Daily Average (Units) Trading Value (¥...

2024年8月売買状況(概算) (立会日数21日) 現物市場 Cash Equity Markets 内国株式 Domestic Stocks 区分 Market 区分 Volume/Value 当月 This Month 前月比(率) Month-on-Month Chan ge (percentage) 前年同月比(率) Year-on-Year Change (percentage) 1日平均 Daily Average 売買高千株 Trading Volume thous.shares 50,020,547 +7,002,854 ( +16.3% ) +15,871,743 ( +46.5% ) 2,381,931 売買代金100万円 Trading Value mil.yen 117,329,312 +8,950,317 ( +8.3% ) +33,814,017 ( +40.5% ) 5,587,110 売買高千株 Trading Volume thous.shares 7,322,245 -150,057 ( -2.0% ) +1,319,668 ( +22.0% ) 348,678 売買代金100万円 Trading ...

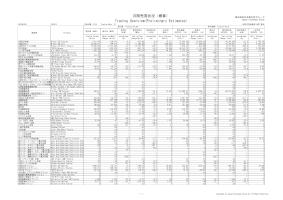
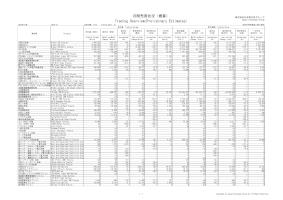
月間売買状況(概算)株式会社日本取引所グループ Trading Overview(Preliminary Estimates) Japan Exchange Group 2024年9月2024/9立会日数:19日Trading Days:19※百万円未満切り捨て表示取引高(単位)前月比(単位) 前月比 (比率) 前年同月比 (単位) 前年同月比 (比率) 一日平均 (単位) 取引金額 (百万円)(※) 前月比 (百万円)(※) 前月比 (比率) 前年同月比 (百万円)(※) 前年同月比 (比率) 一日平均 (百万円)(※) Trading Volume (Units) Month-on-Month Change (Units) percentage (%) Year-on-Year Change(Units) percentage (%) Daily Average (Units) Trading Value (¥...
2024年9月売買状況(概算) (立会日数19日) 現物市場 Cash Equity Markets 内国株式 Domestic Stocks 区分 Market 区分 Volume/Value 当月 This Month 前月比(率) Month-on-Month Chan ge (percentage) 前年同月比(率) Year-on-Year Change (percentage) 1日平均 Daily Average 売買高千株 Trading Volume thous.shares 40,135,111 -9,885,436 ( -19.8% ) +5,029,917 ( +14.3% ) 2,112,374 売買代金100万円 Trading Value mil.yen 95,496,547 -21,832,766 ( -18.6% ) +8,649,067 ( +10.0% ) 5,026,134 売買高千株 Trading Volume thous.shares 6,464,843 -857,403 ( -11.7% ) +690,764 ( +12.0% ) 340,255 売買代金100万円 Trading Value ...
月間売買状況(概算)株式会社日本取引所グループ Trading Overview(Preliminary Estimates) Japan Exchange Group 2024年10月2024/10立会日数:22日Trading Days:22※百万円未満切り捨て表示取引高(単位)前月比(単位) 前月比 (比率) 前年同月比 (単位) 前年同月比 (比率) 一日平均 (単位) 取引金額 (百万円)(※) 前月比 (百万円)(※) 前月比 (比率) 前年同月比 (百万円)(※) 前年同月比 (比率) 一日平均 (百万円)(※) Trading Volume (Units) Month-on-Month Change (Units) percentage (%) Year-on-Year Change(Units) percentage (%) Daily Average (Units) Trading Value (¥...
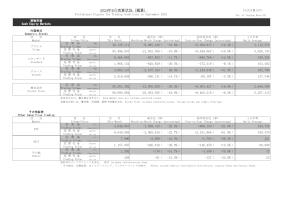
月間売買状況(概算)株式会社日本取引所グループ Trading Overview(Preliminary Estimates) Japan Exchange Group 2024年11月2024/11立会日数:20日Trading Days:20※百万円未満切り捨て表示取引高(単位)前月比(単位) 前月比 (比率) 前年同月比 (単位) 前年同月比 (比率) 一日平均 (単位) 取引金額 (百万円)(※) 前月比 (百万円)(※) 前月比 (比率) 前年同月比 (百万円)(※) 前年同月比 (比率) 一日平均 (百万円)(※) Trading Volume (Units) Month-on-Month Change (Units) percentage (%) Year-on-Year Change(Units) percentage (%) Daily Average (Units) Trading Value (¥...

2024年11月売買状況(概算) (立会日数20日) 現物市場 Cash Equity Markets 内国株式 Domestic Stocks 区分 Market 区分 Volume/Value 当月 This Month 前月比(率) Month-on-Month Chan ge (percentage) 前年同月比(率) Year-on-Year Change (percentage) 1日平均 Daily Average 売買高千株 Trading Volume thous.shares 47,087,297 +85,023 ( +0.2% ) +10,236,438 ( +27.8% ) 2,354,365 売買代金100万円 Trading Value mil.yen 103,901,770 -2,069,232 ( -2.0% ) +12,777,574 ( +14.0% ) 5,195,089 売買高千株 Trading Volume thous.shares 8,032,413 +1,289,580 ( +19.1% ) +1,207,154 ( +17.7% ) 401,621 売買代金100万円 Trading ...
月間売買状況(概算)株式会社日本取引所グループ Trading Overview(Preliminary Estimates) Japan Exchange Group 2024年12月2024/12立会日数:21日Trading Days:21※百万円未満切り捨て表示取引高(単位)前月比(単位) 前月比 (比率) 前年同月比 (単位) 前年同月比 (比率) 一日平均 (単位) 取引金額 (百万円)(※) 前月比 (百万円)(※) 前月比 (比率) 前年同月比 (百万円)(※) 前年同月比 (比率) 一日平均 (百万円)(※) Trading Volume (Units) Month-on-Month Change (Units) percentage (%) Year-on-Year Change(Units) percentage (%) Daily Average (Units) Trading Value (¥...