


「d2」Search results: 1-10 / 225
- sort:
- relevance
- latest
Access (Tokyo) | Japan Exchange Group Map Nearby Stations Entrance Contact Tokyo Osaka Global Offices Wide-area Map Google Maps Detailed Map Kayabacho Station Exit #11 (Tozai line) 5-minute walk Kayabacho Station Exit #7 (Hibiya line) 7–minute walk Nihombashi Station Exit #D2 (Toei Asakusa line) 5-minute walk Tokyo Station Yaesu Chuo Exit (JR line) 20-minute walk [KABUTO ONE] Direct access to Kayabacho Station Nihombashi Station Exit #D2 (Tozai line, Hibiya line, Toei Asakusa line) 2-minute walk Floor Guide Group/Individual Visitors Visitors wishing to enter TSE Arrows or attend events held in the building should proceed to the west entrance for groups and individuals. Other visitors may proceed to the south entrance. (Note) ・Security checks are performed on all visitors upon entry. ・There is no visitor car parking available and public transportation is recommended. For more information on Visiting TSE Arrows, please click on the link ...

) BA West Area Peakload Electricity (Weekly) BB East Area Baseload Electricity (Weekly) BC East Area Peakload Electricity (Weekly) BD West Area Baseload Electricity (Fiscal Year) BE West Area Peakload Electricity (Fiscal Year) BF East Area Baseload Electricity (Fiscal Year) BG East Area Peakload Electricity (Fiscal Year) BH Niigata Koshihikari EXW (Osaka Dojima Exchange) D0 Yellow Corn50 (Osaka Dojima Exchange) D1 US Soybeans (Osaka Dojima Exchange) D2 Azuki beans (Osaka Dojima Exchange) D3 Raw Sugar (Osaka Dojima Exchange) D4 Gold Rolling Spot (Osaka Dojima Exchange) D5 Silver Rolling Spot (Osaka Dojima Exchange) D6 Platinum Rolling Spot (Osaka Dojima Exchange) D7 Rice Index (Osaka Dojima Exchange) D8 Copyright©Securities Identification Code Committee ALL RIGHTS RESERVED....
) BA West Area Peakload Electricity (Weekly) BB East Area Baseload Electricity (Weekly) BC East Area Peakload Electricity (Weekly) BD West Area Baseload Electricity (Fiscal Year) BE West Area Peakload Electricity (Fiscal Year) BF East Area Baseload Electricity (Fiscal Year) BG East Area Peakload Electricity (Fiscal Year) BH Niigata Koshihikari EXW (Osaka Dojima Exchange) D0 Yellow Corn50 (Osaka Dojima Exchange) D1 US Soybeans (Osaka Dojima Exchange) D2 Azuki beans (Osaka Dojima Exchange) D3 Raw Sugar (Osaka Dojima Exchange) D4 Gold Rolling Spot (Osaka Dojima Exchange) D5 Silver Rolling Spot (Osaka Dojima Exchange) D6 Platinum Rolling Spot (Osaka Dojima Exchange) D7 Rice Index (Osaka Dojima Exchange) D8 Copyright©Securities Identification Code Committee ALL RIGHTS RESERVED....

; (iii) if“Actual/360”is specified in the relevant Final Terms, the actual number of days in the Interest Period divided by 360; (iv) if“30/360”,“360/360”or“Bond Basis”is specified in the relevant Final Terms, the number of days in the Interest Period divided by 360 calculated on a formula basis as follows: Day Count Fraction = [360 x (Y2 -Y1)] + [30 x (M2 -M1)] + (D2 -D1) 360 where: “Y1”is the year, expressed as a number, in which the first day of the Calculation Period falls; “Y2”is the year, expressed as a number, in which the day immediately following the last day included in the Calculation Period falls; “M1”is the calendar month, expressed as a number, in which the first day of the Calculation Period falls; “M2”is the calendar month, expressed as a number, in which the day immediately following the last ...
in this study with the experimental results obtained usingTOPIX data. Further discussion basedon additional experimen- tal results is then presented in Section 4. 3.1 Data Representation We use the following simple vector representation, vt, of the data: pt,d = Price of stock on d-th day of month t pt = Price of stock on last day of month t dt = (pt−pt−1)/pt−1 d2,t = (dt + 1)∗(dt−1 + 1) d3,t = (dt + 1)∗(dt−1 + 1)∗(dt−2 + 1) st = vutlast day of month t ∑d=1 (pt,d/pt−1−1)2 number of days of month t vt = (dt, st, dt−1, d2,t, st−1) dt−2, d3,t, st−2) where pt is the stock price of month t, dt is the price fluctuation between the current and the previous month, st is the standard deviation of the daily stock price ...
@ 8 6 ) 8 ! ) ! 0 6 ) " 9 UVWH
h ) ! 6 " ) 7 ) ! 6 5 9 " cdefgH@ " 6 7 0 " 8 5 6 9 C 5 H0 6 0 " @ ) 6 ) ! ! xy! 7 6 9 " @ ) 9 6 9 8 ) UVWH ) " ) 6 7 7 5 ) ! ) 6 @ ! C EF @ ) 5 6 C 7 7 ! 0 7 6 @ 5 " EF e2F 0 6 7 C 7 ! " 5 Bd2F ! " " s EF 0 6 9 C 7 ! " 5 ef Vghe ! 9 0 6 ! " @ s xy! " " s ef ! 9 0 6 C " @ s ibjkl8mEF 0 C 5 6 9 5 C ! 0 7 6 8 5 5 noipqriIPVi @ C 6 8 @ 9 ) ) @ 6 7 " 5 noijkls ) C 6 5 ) @ ) " 6 ) 0 @ noij 9 5 6 9 8 C ) ! @ 6 @ C 7 mEF ! 9 " 6 " ) " ) " 5 6 ! 7 0 tauvwxyz{mEF s s |}~uvwxyz{mEF ! 9 " 6 " ) " ) " 5 6 ! 7 0 eFIP
EF...
w% p # @ p # @ $ p p @ % ghih`ahq % p q $ p # $ # p $ # 34hdefghijklI % p x $ p q x x p % # q p Q mnkl t t `aI % p x $ p q x x p % # q p Q VWXY`aI Q $ p % Q @ p $ # % p Q p # Q 12345678696 ! " # $ # % &'() 0123)4 567 9 9 @AB CD 23 )E FG HI5 PQ RC D2 3) EFS TU HI 5P CD23)EFGHI5P 0123)EFVI)W XY`ab" c0123)EFVI)W d# $ # # &e(fg h# $ # i &f(i g" p0123)EFVI)W d# $ # i &e(fg h# $ # % &f(i g" qrsH t i % t i u v t u u % t # # qrwx yt v t $ # i y# t$ t v % qrUH yG" yi t v # t # y % t # i q
QR
y% t v % t % i u yv t i t i % sH # t u # t v ...
%X d9 IBS6 3èe 3 âf "#% f gÓIh3èe3 i1bppi QTbc9%56 f gÓIh 3èe3 2õöñòh CîéêåjëåTíîyp%iÆ SÇõö7 !1 kl mnpDøpiyo oph$QT â! 9% p6T4v64åd q r s tuÇ% vÓrÌa tuÇj wp%6Âõöd2j6 T 4v64åd q x s a U tuÇj 1ûpiQTQ yzõöd2 p j6 T4v64åpd { q g U tuÇ% |T4v64åj1 }ûpiQT d2jÂõö4
1~ Â õöTèhÿÇ0¢6 # %Ç
%û
®1ª9 õö6 12 34 5 6 78 9 6 ! 7" #$ %& ' () 012 3 4 56 67 89 @ 9A BC D E6 F HIB P6" 9#$ QRS T U V U W XY ` a V &6 bcd efg hipq rIB bc stu v6 wxy66 7
1Dp9 %4 bcFH uv! Du vd ye f ghij 11k il i m"% 67n 1op 6
"Dqh ...
3456789@ABCDEF p" W ! ! ! wHywHxIy5z7{|}i X ) wHywHxIyghYi0pqYr6 V $ W )) wHywHxIyg~ $ W!W V V ) wHywHxIyg $ W! W X 00689@ABCDEF|
0123456789 0 !"#$%&2 ()0123456 0789@$ABCDEFGH1IPQR$2 ()0123456 03456789$STUV$WXY`$ab2 0cAdb$Xe2 cAdbfEg0h)ip34567WX5qrst67WXuv$cw%)5xycWXab $
crR`2hcw%345xy)(
crgXeDg236 0d2 )efgh$i0jklfm#n$op12hq$r$#0st$uvwHxDE Pyhz{$|r}~Dg236 02 067We$e72
us$WEgherDhep123DP)e$67Wep1 gh7We0h
up pe7EPD3DP6 ¡¢e$`£ )(67We0h¤¥¦§Eg#¨©ªH!«h¬®r¯yg«3DPHh°¬0±2345p DP69²0³´µ¶A·2$¸¹ºgh»¼$¯½¾¿hÀÁÂÃHÄDžIPÆ{pÇÈe0ÉÊ DhË$# !0ÌÍ{ÎÏEPD3DP6 p¢)(67We$Ðv 0¡2ÑÒgh7We 0p2ÓÔÕÖ×ØÙÚÛÜÝÞßàááâãäåægçèéf
ê 0ë2ìíî@ïð 012#ñòóôhõöµ÷gøùúûüS# 0ý29@Aþ
ÿ» 0 0 ...
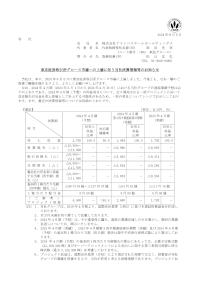
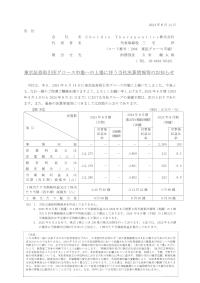
593 593 2,965,000 2,965,000 2,965,000 A種優先株式 90 90 450,000 450,000 450,000 B種優先株式 (株) 59 59 295,000 295,000 295,000 C種優先株式 91 91 455,000 455,000 455,000 D種優先株式 ― 300 1,700,000 1,700,000 1,700,000 D2種優先株式 ― ― ― 734,500 832,900 純資産額 (千円) 120,897 1,148,747 758,979 923,616 313,113 総資産額 (千円) 368,962 1,581,859 1,385,262 1,666,648 1,484,617 1株当たり純資産額 (円) 143,934.55 1,013,837.52 129.37 139.91 46.55 1株当たり配当額 (1...