Explanation of Indices/Indicators (ETFs)
Covered Call Indicator
A Covered Call Indicator is modeled to represent profits in the case where the Covered Call strategy was employed for a given asset (individual stocks, stock price indices, etc.; hereinafter “underlying assets”, including the referenced indices). This type of indicator is generally a type of Enhanced Indicator (an index which represents investment results for a certain investment strategy). The Covered Call strategy is a leading investment strategy using options trading. This strategy is employed when the underlying stocks or stock price index is not expected to fluctuate largely over the short-term by holding such underlying asset while also selling options. Though profits are limited in cases where the underlying asset price rises greatly, this strategy is used when aiming to improve returns on receipt of the options premium.
For example, in the case of a Covered Call Indicator with the Nikkei 225 index as the underlying asset, the indicator would be a model of profits from the combination of holding Nikkei 225 constituent stocks (225 stocks used in the Nikkei 225) and selling Nikkei 225 call options (index options trading whose underlying asset is the Nikkei 225).
Difference with Underlying Asset
Because a Covered Call Indicator combines underlying assets with the sale of call options, it does not produce the exact same price movements as the underlying asset.
In cases where the underlying asset moves at a level below the strike price of the call option, because striking the call option will not be taken into account, fluctuations will be increased by the equivalent of the call option only in comparison to the underlying asset. However, movements of the Covered Call Indicator and the underlying asset will generally be the same.
On the other hand, in cases where the underlying asset moves at a level above the call option’s strike price, such strike price will be taken into account and the correlation between the underlying asset and the Covered Call Indicator will decrease. In such cases, the Covered Call Indicator will rest at a level close to the strike price.

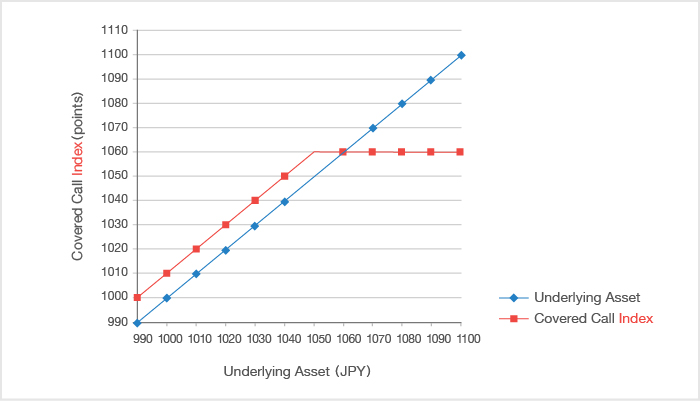
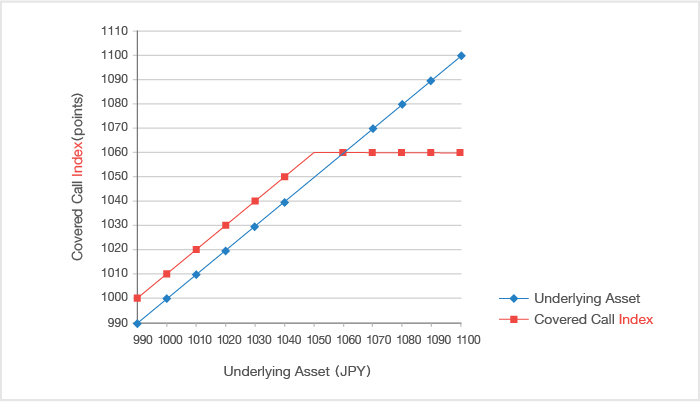
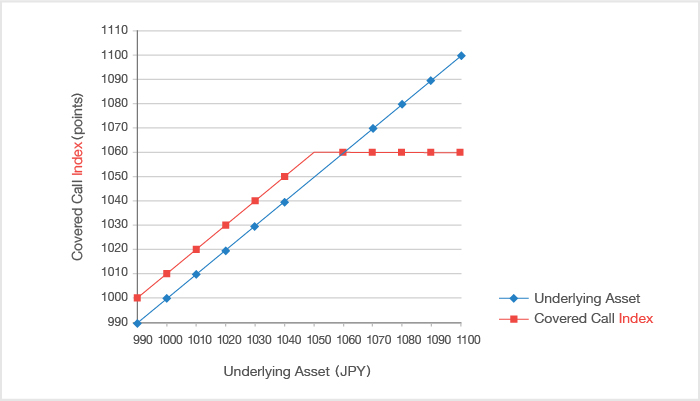
- ・The above graph shows the price movements of a Covered Call Indicator where a call option on the underlying asset (Strike Price: JPY 1,050) was sold at a premium of JPY 10 and the underlying asset itself. In this model, if the price of the underlying asset reached JPY 1,020, the Covered Call Indicator is expected to be 1,030 points. Also, if the price of the underlying asset reached JPY 1,080, the Covered Call Indicator is expected to be 1,060 points.
- ・The strike price and premium of the call option change according to the timing of the option’s sale, as does the limiting maximum.
Traits of Covered Call Indicators
The following is a specific explanation of Covered Call Indicator price movements. The Covered Call Indicator shall be the same used in Section 1.
By combining the underlying asset with the sale of a call option, Covered Call Indicators have the following traits.
Cases where the Underlying Asset Value Moves at a Level Lower than the Call Option’s Strike Price
Movements will occur at a generally higher level than the underlying asset value due to being raised by the amount of the call option’s premium. However, the rate of daily fluctuation will be generally the same as the underlying asset.
In cases of the underlying asset value moving at a level lower than the call option’s JPY 1,050 strike price, because the buyer of such option will generally forfeit such rights (because the underlying asset is cheaper than the strike price, it is expected such option will not be exercised), the Covered Call Indicator will generally move at a level higher than the underlying asset value by an approximate amount of the call option's premium. The rate of daily fluctuation will generally be the same as that of the underlying asset.

Cases where the Underlying Asset Value Moves at a Level Higher than the Call Option’s Strike Price
Due to the strike price of the call option, the indicator will not rise to the same level as the underlying asset's price.
In cases where the underlying asset price moves at a level higher than the JPY 1,050 strike price of the call option, because the buyer of such option will general exercise it (because the underlying asset is more expensive than the strike price, it is expected such option be exercised), the Covered Call Indicator will not enjoy the same price increase as the underlying asset (despite price increases for the underlying asset, it must be provided to the call option buyer at JPY 1,050. Though the underlying asset will not actually be provided to the buyer, profit/loss will be reflected in the Covered Call Indicator as if it had). Even if the price of the underlying asset rises, the Covered Call Indicator will not rise beyond the point of JPY 1,050 plus the call option's premium.

Differences in Profit/Loss with ETFs tracking Underlying Assets
Due to the traits above, the differences in profit/loss between an ETF tracking a Covered Call Indicator and an ETF tracking the underlying asset are as follows.
Capital Gain (Profit Gained from Price Movements)
- Cases where the Underlying Asset Moves at a Level Lower than the Call Option’s Strike Price
Because daily price movements of the Covered Call Indicator will generally be the same as the underlying asset, profit/loss due to price movements will be at the same level. - Cases where the Underlying Asset Moves at a Level Higher than the Call Option’s Strike Price
Though the price of the underlying asset rises, because the Covered Call Indicator will not rise above the level of the call option’s premium added to the strike price, profits resulting from a rise in the underlying asset price are limited compared to ETFs tracking the underlying asset.
Income Gain (Profit Gained from ETF Dividends)
Compared to ETFs tracking the underlying assets, holders of ETFs tracking a Covered Called Indicator can expect profit from premiums in addition to constituent stock dividends, etc.
Please note that distribution plans vary according to the issue. Please confirm the details for each issue via the Securities Registration Statement, Prospectus, or other materials related to such ETF.
Notes on Investment Styles
Caution is required for investment in cases where short-term gains are expected.
Profits will be limited in cases where the underlying asset rises beyond the call option’s strike price until the next call option is sold. Thus, please be cautious of investing when short-term gains are expected.


