


Explanation of Indices/Indicators (ETFs)
Factor Model Indicators
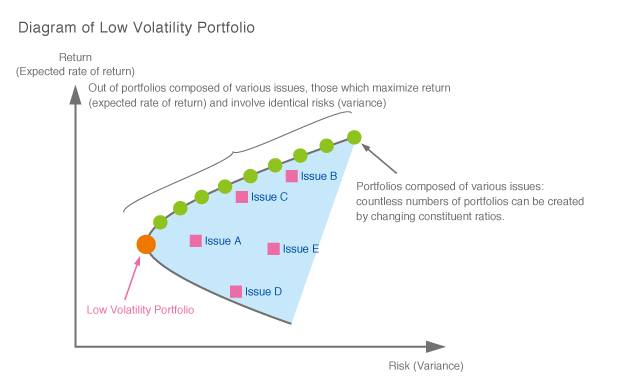
Factors refer to common attributes that may affect price movements of investment assets such as equities, bonds, and REITs. Some examples include market volatility, company size, price book-value ratio (PBR), price earnings ratio (PER), return on equity (ROE), currency fluctuations, and interest-rate fluctuations. Factor investing has become popular in recent years due to its usability as a risk management tool given that the return on various types of investment assets can be explained by a select number of common factors. Quintessential factors used under such investment strategies include: a) high yield, where issues that produce high stock dividends or dividend yields are selected; b) quality, where highly profitable issues with favorable ROE, financial leverage, etc. are selected; c) fundamentals, where the selection of issues is based on financial indicators such as sales revenue or sales cash flow; and d) low volatility, where issues likely to have the lowest risk for steep price movements are selected.
Examples of ETFs Tracking Factor Model Indicators
ETFs that track indices focused on factors such as high yield and minimum volatility are listed on the Tokyo Stock Exchange. The characteristics of each ETF are disclosed in the securities registration statements of the ETFs and on the websites of asset management companies.